SCBHandlerPlotter, plotting public statistics on maps
Mar 24, 2021
·
1 min read
A little project to make it easier to explore some statistics provided by Statistics Sweden, the Swedish public statistics agency. It provides a handy syntax to grab data that does not require the user to remember which data is in which table, and a function for plotting this data on a map of the country.
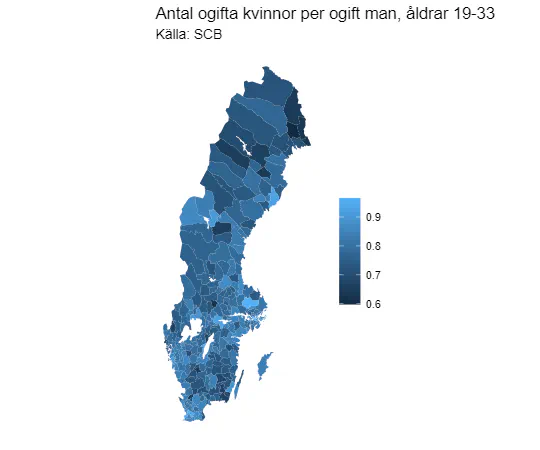
Here is one example of such a plot, showing the number of unmarried women per unmarried man in the age span 19-33. The data reveals the expected trends – the rate is highest in the university towns, while in the depopulating rural areas in the north, it is much lower.
This is probably my most “mature” project code-wise, in terms of having properly set up unit tests with good coverage, and generally adhering to good coding practices.